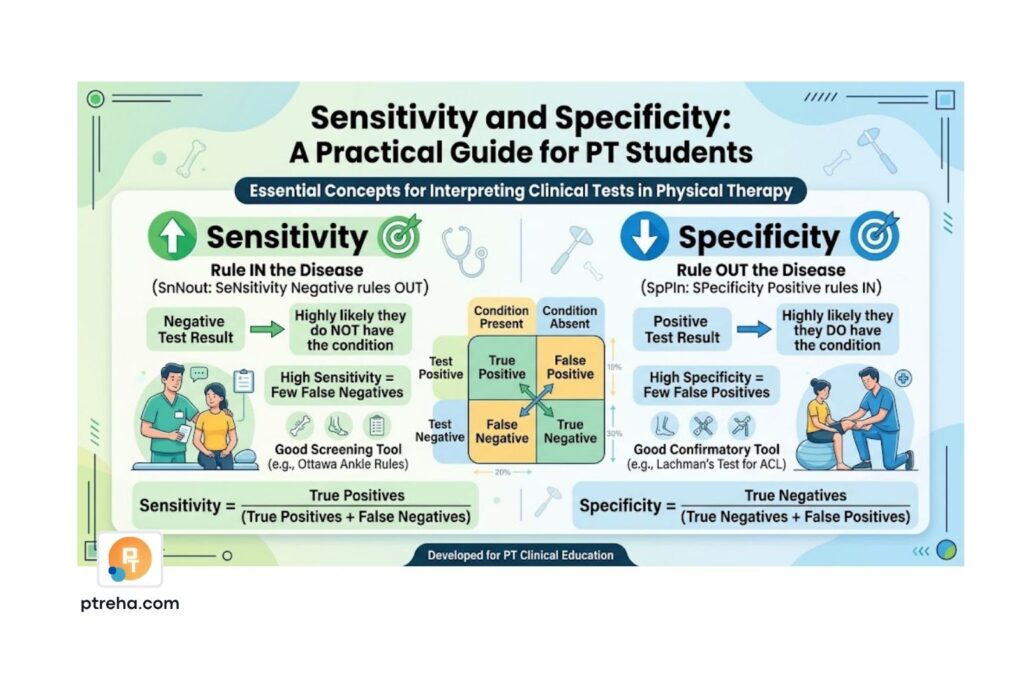
Positive PT Test Sensitivity and specificity describe how well a test identifies people with and without a target condition.
For PT students, understanding these measures helps you interpret special tests, read diagnostic research, and explain why a positive or negative result changes clinical suspicion without necessarily establishing or excluding a diagnosis.
What Sensitivity and Specificity Mean
Sensitivity is the proportion of people with the target condition who test positive.
Specificity is the proportion of people without that condition who test negative.
The distinction starts with the group you are examining:
- Sensitivity asks: among people who have the condition, how many test positive?
- Specificity asks: among people who do not have the condition, how many test negative?
- Neither directly answers: what is the probability that this particular patient has the condition after testing?
The American Academy of Family Physicians’ evidence-based medicine toolkit explains these definitions and related diagnostic concepts.
Always attach an accuracy estimate to a specific target condition, testing procedure, and population.
In a PT assessment, reproducing symptoms is an observation.
Whether that observation accurately identifies a particular diagnosis is a separate question requiring evidence.
Understand the Four Possible Positive PT Test Results
A diagnostic accuracy study usually compares the test being evaluated—the index test—with a reference standard, the best available method for determining whether the target condition is present.
A reference standard can be imperfect; describing it as a “gold standard” does not make it error-free.
For a test classified as positive or negative, there are four possible combinations:
- True positive (TP): positive test; condition present according to the reference standard.
- False negative (FN): negative test; condition present according to the reference standard.
- False positive (FP): positive test; condition absent according to the reference standard.
- True negative (TN): negative test; condition absent according to the reference standard.
“Without the condition” does not necessarily mean healthy.
A patient may have another disorder that produces similar symptoms.
Before interpreting a special test, check what the study called positive.
Familiar pain, any pain, weakness, laxity, and an abnormal measurement are different findings; they should not be treated as interchangeable criteria.
The STARD diagnostic accuracy reporting checklist asks researchers to describe the index test, reference standard, and criteria used to classify results.
Calculate Sensitivity and Specificity With a Worked Example
Consider a hypothetical teaching example, not a published study or an accuracy claim for any named PT test.
An examination maneuver is evaluated in 200 people using a prespecified protocol and reference standard, with no missing or indeterminate results.
The reference standard classifies 100 people as having the target condition and 100 as not having it.
| Examination result | Target condition present | Target condition absent | Total |
|---|---|---|---|
| Positive | 90 true positives | 20 false positives | 110 |
| Negative | 10 false negatives | 80 true negatives | 90 |
| Total | 100 | 100 | 200 |
Use the appropriate denominator for each calculation:
- Sensitivity = TP ÷ (TP + FN) = 90 ÷ 100 = 90%.
- Specificity = TN ÷ (TN + FP) = 80 ÷ 100 = 80%.
- False-negative rate = FN ÷ (TP + FN) = 10 ÷ 100 = 10%.
- False-positive rate = FP ÷ (TN + FP) = 20 ÷ 100 = 20%.
In this example, the maneuver detects 90 of the 100 people with the condition.
It correctly gives a negative result in 80 of the 100 people without it.
These percentages describe performance in this constructed sample.
They are not clinical thresholds, universal normal values, or estimates for a real examination maneuver.
A useful study habit is to state the denominator aloud before calculating: “all people with the condition” for sensitivity and “all people without the condition” for specificity.
Distinguish Predictive Values From Sensitivity and Specificity
Once a patient tests positive, the question changes: among people with a positive result, how many have the condition? That is positive predictive value (PPV).
Negative predictive value (NPV) asks how many people with a negative result do not have the condition.
These measures group people by their test result rather than by whether the condition is present.
Using the same hypothetical table:
- PPV = TP ÷ (TP + FP) = 90 ÷ 110 ≈ 81.8%.
- NPV = TN ÷ (TN + FN) = 80 ÷ 90 ≈ 88.9%.
- A sensitivity of 90% therefore does not mean a positive result gives a 90% probability of the condition.
Predictive values depend on how common the condition is in the tested population.
If sensitivity and specificity remain constant, lower prevalence reduces PPV and increases NPV; higher prevalence does the reverse.
For another hypothetical example, suppose a test has the same 90% sensitivity and 80% specificity in 1,000 people, but only 100 have the condition.
There would be 90 true positives, 10 false negatives, 180 false positives, and 720 true negatives.
PPV would then be 90 ÷ 270, approximately 33.3%, while NPV would be 720 ÷ 730, approximately 98.6%.
The assumed sensitivity and specificity are unchanged, but the meaning of a positive result differs substantially.
The National Cancer Institute’s biomarker analysis tools illustrate relationships between test performance, prevalence, and predictive values.
A study’s PPV should not automatically be assigned to a patient from a different clinical population.
Use SnNout and SpPin as Memory Aids
Students often learn SnNout: a highly sensitive test, when negative, can help rule out a condition.
SpPin means that a highly specific test, when positive, can help rule in a condition.
These phrases are useful reminders, but the word “help” matters.
A single accuracy measure cannot tell you the full effect of a test result.
- A negative result is more informative when its negative likelihood ratio meaningfully lowers probability.
- A positive result is more informative when its positive likelihood ratio meaningfully raises probability.
- The resulting probability still depends on the probability before testing.
For a hypothetical counterexample, a test with 99% sensitivity and 1% specificity has a negative likelihood ratio of (1 − 0.99) ÷ 0.01 = 1.
Its negative result does not change the odds, despite the high sensitivity.
Likewise, a hypothetical test with 1% sensitivity and 99% specificity has a positive likelihood ratio of 0.01 ÷ (1 − 0.99) = 1.
High specificity alone does not guarantee an informative positive result.
Oxford’s explanation of SpPin and SnNout provides context for these mnemonics.
Use them to remember a direction of reasoning, then check both sensitivity and specificity rather than treating the mnemonic as a diagnosis.
Use Likelihood Ratios to Update Clinical Suspicion
A likelihood ratio (LR) compares how likely a particular test result is in people with the target condition versus people without it.
For a binary test, both sensitivity and specificity contribute to the calculation.
Enter percentages as decimals:
- Positive likelihood ratio (LR+) = sensitivity ÷ (1 − specificity).
- Negative likelihood ratio (LR−) = (1 − sensitivity) ÷ specificity.
- An LR of 1 leaves the odds unchanged.
- An LR above 1 increases the odds; an LR below 1 decreases them.
These formulas are described in Oxford’s evidence-based medicine glossary.
There is no single likelihood ratio that automatically makes every clinical decision safe or appropriate.
In the original hypothetical example, LR+ = 0.90 ÷ 0.20 = 4.5, and LR− = 0.10 ÷ 0.80 = 0.125.
Now assume a hypothetical pretest probability of 20%.
This is a teaching assumption, not an estimate for a real patient or condition.
- Convert probability to odds: 0.20 ÷ (1 − 0.20) = 0.25.
- For a positive result: 0.25 × 4.5 = 1.125 post-test odds.
- Convert back to probability: 1.125 ÷ (1 + 1.125) ≈ 52.9%.
- For a negative result: 0.25 × 0.125 = 0.03125 post-test odds, giving approximately 3.0% probability.
The same test raises suspicion after a positive result and lowers it after a negative result.
Neither calculation determines the next action by itself; that depends on the suspected condition, consequences of error, available options, and applicability of the evidence.
Do not multiply pretest probability directly by the likelihood ratio.
The multiplication applies to odds.
Why Accuracy Estimates Can Differ Between Studies
Sensitivity and specificity do not include prevalence directly in their formulas.
That does not make them fixed characteristics that remain identical across every patient group or testing method.
When reading conflicting results, compare:
- Patient spectrum: severity, stage, and alternative diagnoses.
- Setting: community practice, specialty clinics, or surgical populations.
- Protocol: positioning, instructions, examiner technique, and positive criteria.
- Reference standard: how the target condition was established.
- Study methods: selection, blinding, missing results, and verification procedures.
If higher scores indicate the condition, lowering the positive cutoff generally increases sensitivity while reducing specificity.
A receiver operating characteristic, or ROC, curve displays sensitivity against the false-positive rate across thresholds.
A cutoff selected to maximize performance in one dataset needs further evaluation before being treated as established practice.
Choosing a clinical threshold also involves the consequences of false positives and false negatives.
Read Diagnostic Research Before Applying the Numbers
A headline percentage cannot show whether a study matches the patient in front of you.
Read the methods and uncertainty alongside the results.
Use this practical appraisal checklist:
- Were participants recruited in a way that represents the intended clinical population?
- Could you reproduce the testing procedure and positive criteria?
- Was the reference standard appropriate for the target condition?
- Were test interpretations sufficiently independent of each other?
- Were missing and indeterminate results explained?
- Were accuracy estimates accompanied by confidence intervals?
The EQUATOR Network’s STARD guidance supports transparent reporting.
It is a reporting guideline, not proof that a study is unbiased.
A wide confidence interval signals uncertainty about the estimate.
Even observing no false negatives in a small sample does not establish that the test will never miss the condition.
For your study notes, record the population and protocol beside each percentage.
That habit makes it harder to memorize a number while forgetting where it applies.
Apply the Findings During a PT Assessment

Start by identifying what you are trying to establish.
A test used to reproduce symptoms or measure performance should not automatically be treated as a validated diagnostic test.
For example, a patient with shoulder pain may report familiar symptoms during a maneuver.
Documenting that response is useful, but assigning a specific tissue diagnosis requires evidence that the finding meaningfully distinguishes that condition from relevant alternatives.
A practical sequence is:
- Define the target condition and reason for testing.
- Establish initial suspicion from the history and examination.
- Select an appropriate test supported by applicable evidence.
- Perform and interpret it using the specified protocol.
- Decide how the result changes suspicion and the next step.
An unclear or incomplete test should be documented as such rather than forced into a positive or negative category.
A negative result also should not override concerning findings that still require further assessment or referral.
When several tests are available, their agreement can be clinically useful, but related tests may provide overlapping information.
Do not assume independence and multiply their likelihood ratios unless that approach is justified; use validated combinations when applicable.
Explain uncertainty in language the patient can understand:
- “This finding increases our suspicion, but it does not confirm the diagnosis by itself.”
- “The result lowers our suspicion; we still need to consider your other findings.”
- “The test was limited, so its result is uncertain.”
Key Takeaways
Sensitivity and specificity describe test performance within groups whose condition status is established by a reference standard.
Predictive values and likelihood ratios help connect those findings to the questions clinicians face after testing.
For PT students, the essential habit is to combine the result with the patient’s presentation, the quality and applicability of the evidence, and the consequences of the next decision.
Accurate arithmetic is useful only when the test is answering the right clinical question.
Frequently Asked Questions
What is the easiest way to remember sensitivity and specificity?
Sensitivity starts with people who have the condition and asks how many test positive.
Specificity starts with people who do not have the condition and asks how many test negative; remembering the starting group helps prevent denominator errors.
Does 90% sensitivity mean a positive result is 90% accurate?
No.
It means 90% of people with the target condition test positive under the relevant study conditions; the proportion of positive results that represent the condition is the positive predictive value.
Is sensitivity or specificity more important for PT special tests?
The answer depends on the test’s intended role and the consequences of error.
Consider both measures, likelihood ratios, and the clinical context rather than selecting a test solely because one percentage is high.
Can a highly sensitive test completely rule out a condition?
A negative result can lower suspicion, but high sensitivity alone does not guarantee exclusion.
The negative likelihood ratio, initial probability, study uncertainty, and remaining clinical concerns determine how reassuring the result is.
Can a highly specific test confirm a diagnosis?
A positive result may substantially increase suspicion when the positive likelihood ratio is informative.
Whether it provides enough evidence for a diagnosis or action depends on the complete assessment and the requirements for establishing that particular condition.
Does prevalence change sensitivity and specificity?
Prevalence is not directly included in their formulas, whereas it influences predictive values.
However, populations with different prevalence may also differ in severity or other characteristics that change observed sensitivity and specificity.
How are reliability and diagnostic accuracy different?
Reliability concerns consistency, such as agreement between examiners or repeated measurements under suitable conditions.
Diagnostic accuracy concerns classification against a reference standard; a consistently reproduced result can still classify patients incorrectly.
What should I do when a special test gives an unclear result?
Record the actual response and explain why interpretation was limited.
Do not apply accuracy estimates based on clearly positive or negative results as though an indeterminate finding were equivalent.
Can I combine several tests to get a more certain answer?
Potentially, if the combination has appropriate supporting evidence and fits the clinical setting.
Avoid simply multiplying likelihood ratios from related tests, because overlapping information can exaggerate the apparent certainty.
What should I record when learning a test’s accuracy?
Record the target condition, patient population, procedure, positive criteria, reference standard, sensitivity, specificity, and uncertainty.
Include likelihood ratios when available so you can interpret the result rather than memorize an isolated percentage.